Production chains textile & meat / 2012

Visualizations help immensely to reduce complexity to a minimum.
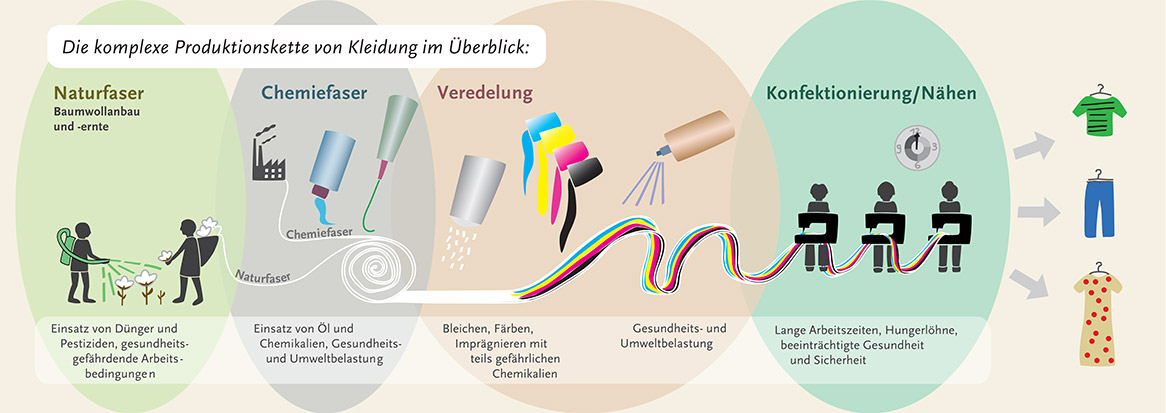
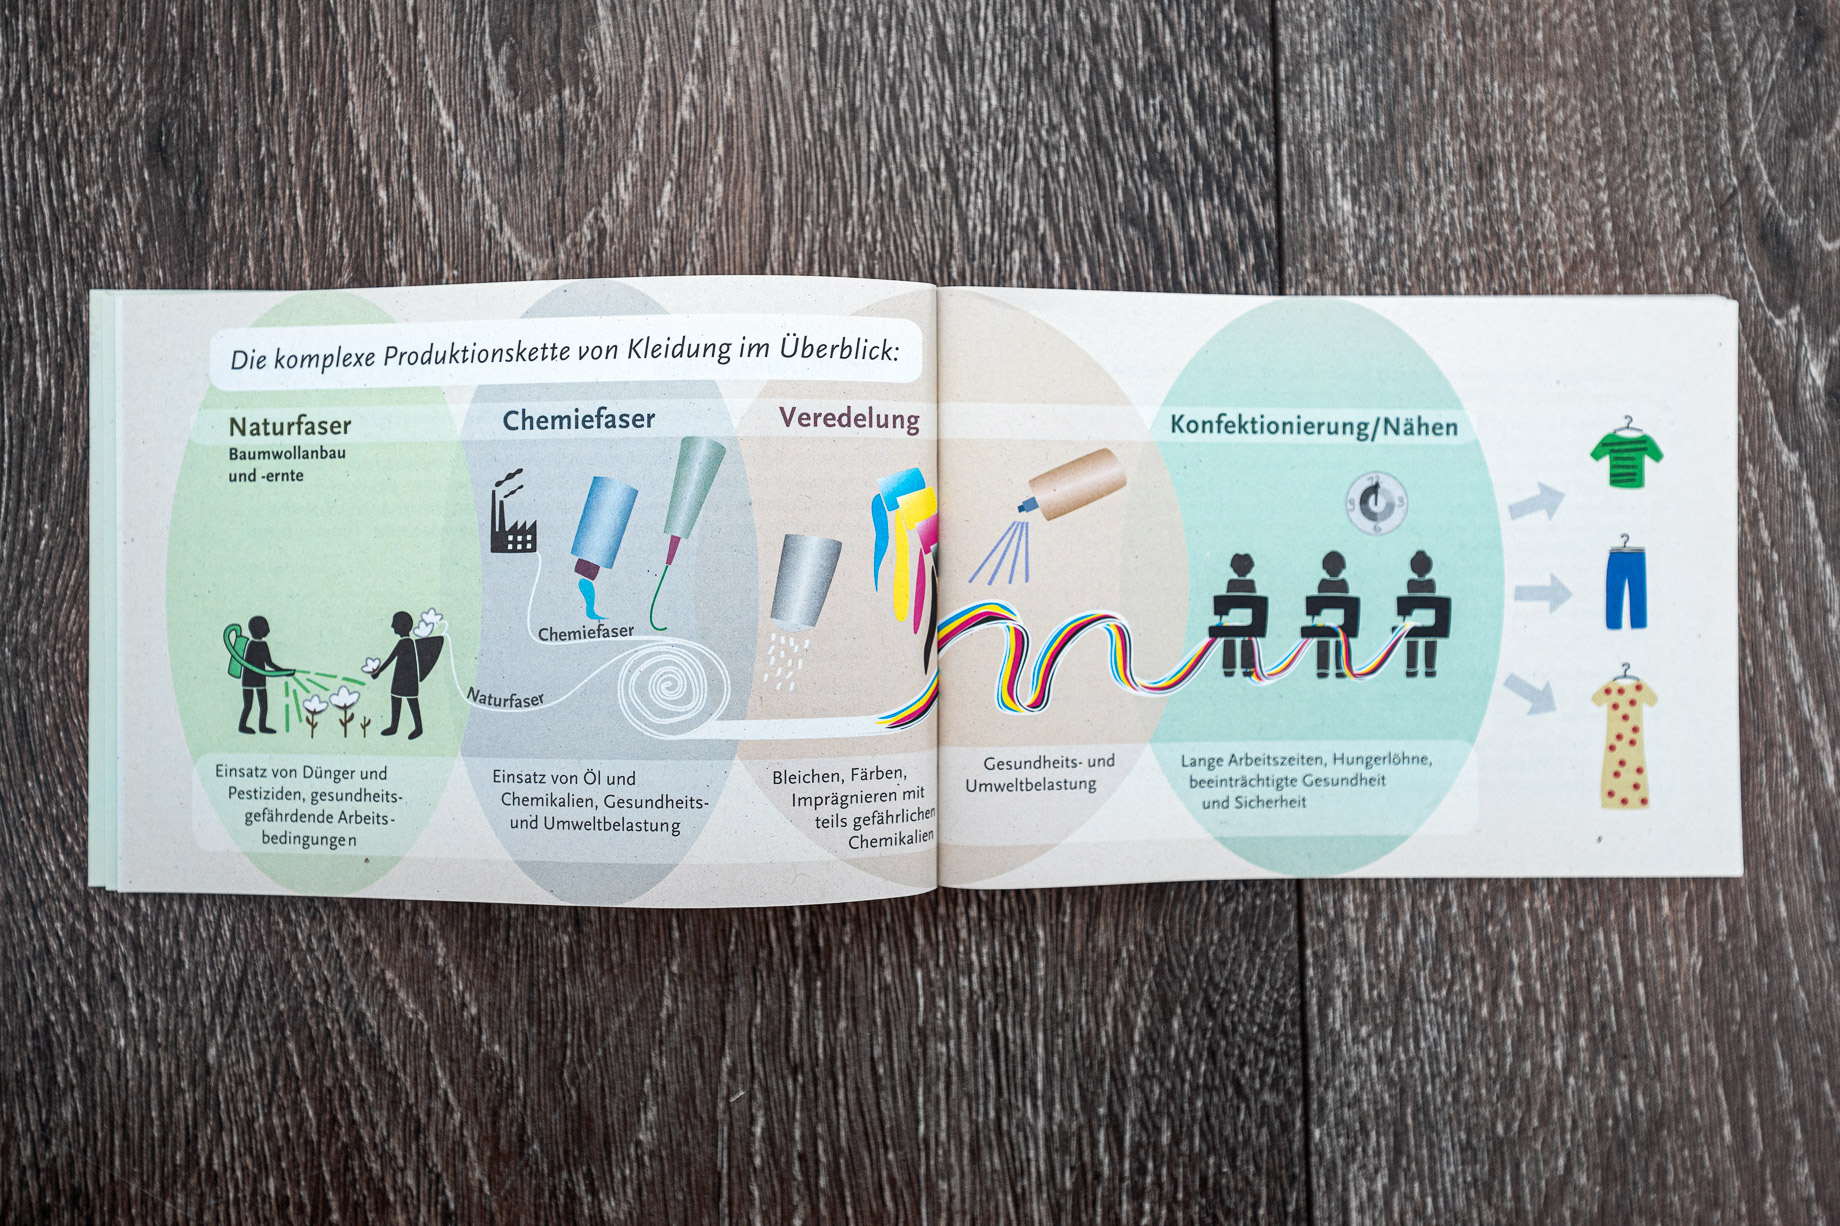
How is my T-Shirt being made?
This infographic depicts the production chain of textiles: from unhealthy cotton harvesting, chemical dyeing and sewing around the clock.
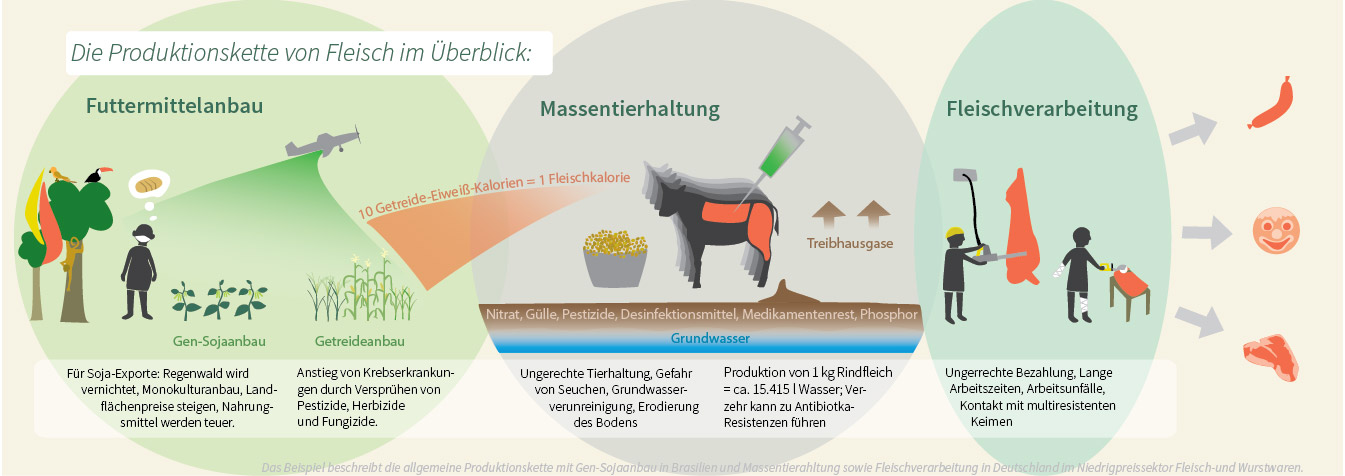
How does the steak get on my plate?
About destroying rain forest for growing soja, polluting valuable ground water and working conditions in butcheries.
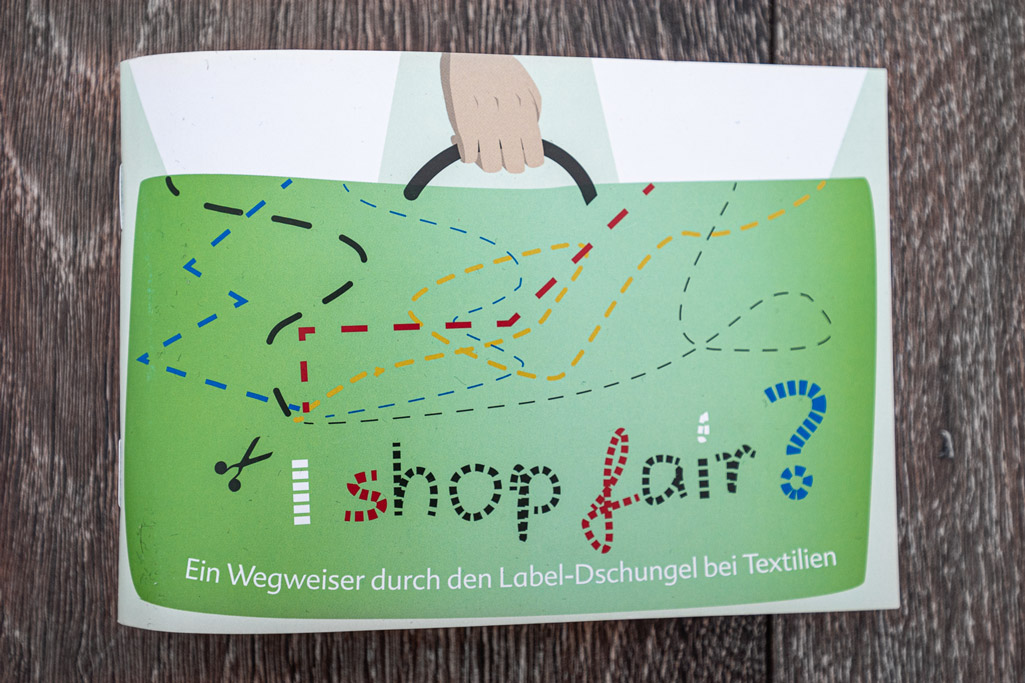
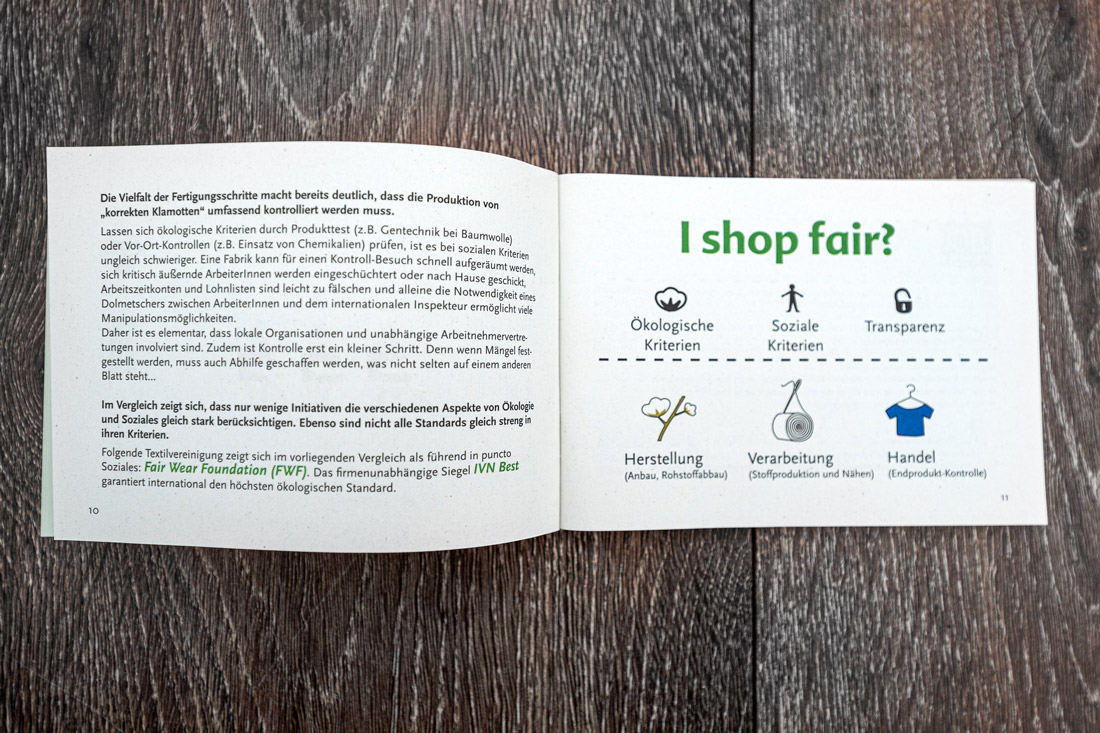
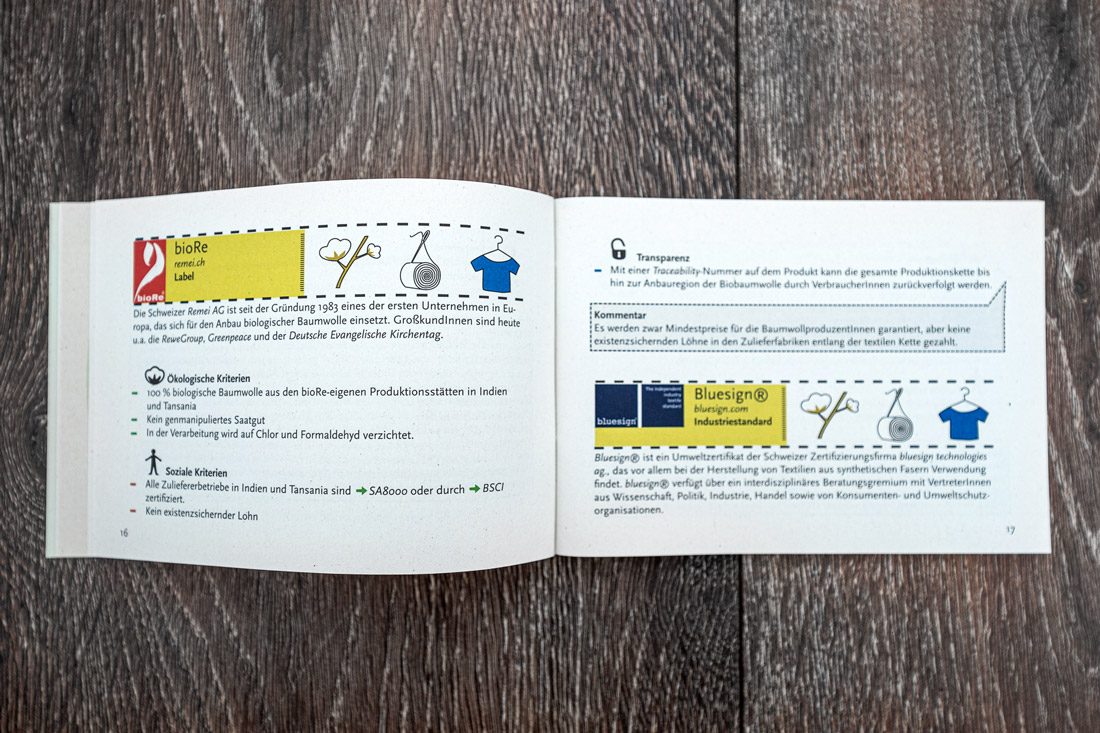
Done for Christliche Initiative Romero e.V. (CIR) in 2012. The infographic is part of a 30 page long brochure, which shines a light on the many icons around textile production chains. What they promise – and what they actually take responsibility for.
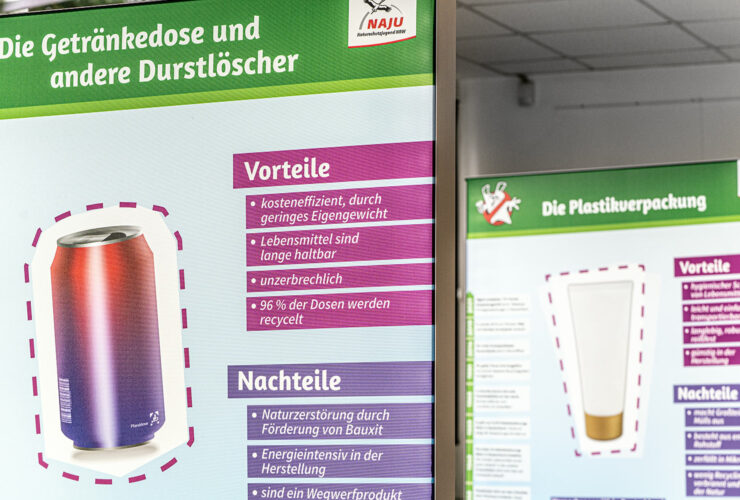
Plastic Cycle

About eight million tonnes of plastic end up in the sea each year. Fish eat it – and then we do.
Our playful infographic gives an overview of how plastic circles around our lives.
Done in cooperation with NAJU (German Youth Association for the Protection of Nature) originally in 2014. Above an updated version from 2022.
„Scientists at Ghent University in Belgium recently calculated that shellfish lovers are eating up to 11,000 plastic fragments in their seafood each year. We absorb fewer than 1%, but they will still accumulate in the body over time.“
Article in guardian, 2017.
…more coming soon!
…more coming soon!